How does the federal income tax deduction for state and local taxes work?
Taxpayers who itemize deductions on their federal income tax returns can deduct state and local taxes--specifically property taxes plus either income taxes or general sales taxes. However, the Tax Cuts and Jobs Act limits the total state and local tax deduction to $10,000.
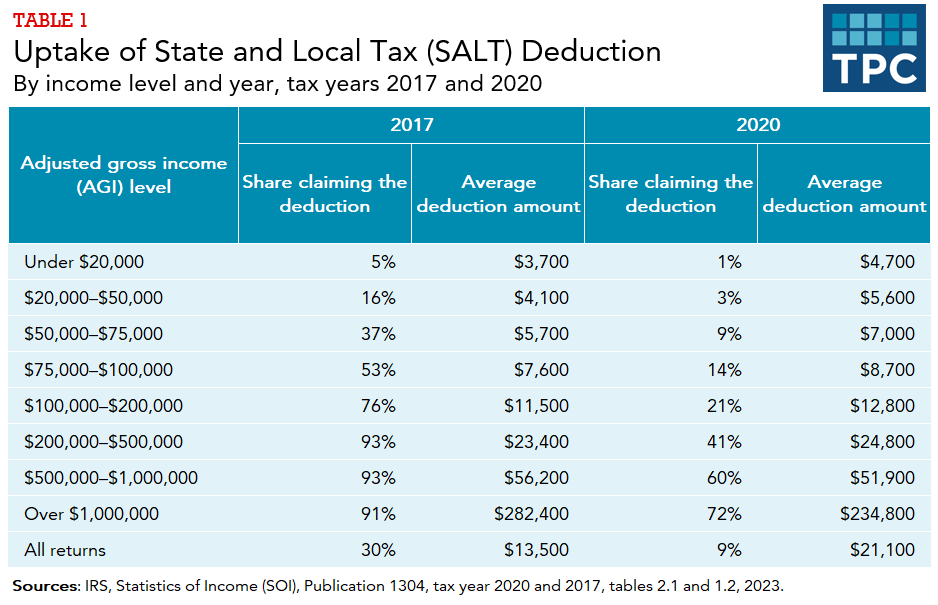
The state and local tax (SALT) deduction was, until recently, one of the largest federal tax expenditures. Thirty percent of taxpayers claimed the deduction in 2017, with an estimated cost of $104 billion in forgone revenue, per the Treasury’s estimates.
However, the Tax Cuts and Jobs Act (TCJA) significantly increased federal standard deduction amounts (thereby reducing the number of taxpayers who itemize deductions) and capped the total SALT deduction at $10,000. As a result, the share of filers claiming the SALT deduction fell to 9 percent, with the estimated revenue costs dropping to $13.5 billion in 2020.
Before the TCJA, virtually all filers who itemized claimed a deduction for state and local taxes paid. Still, among itemizers, high-income households were more likely than low- or moderate-income households to benefit from the SALT deduction because high-income households paid more in state and local tax (i.e., larger total deductions).
After the TCJA’s changes, the SALT deduction is now claimed almost exclusively by high-income households. In 2020, only 3 percent of tax filers with adjusted gross income (AGI) between $20,000 and $50,000 claimed the SALT deduction compared to 21 percent for tax filers with AGI between $100,000 and $200,000 and over 45 percent of tax filers with AGI above $200,000 (table 1). Tax filers with AGI above $100,000 were 19 percent of all tax filers, but accounted for about 87 percent of the total dollar amount of SALT deductions reported. The average deduction claimed in this group was about $31,000.
Broadly speaking, this means households, and particularly high-income households, saw less benefit from the SALT deduction as a result of the SALT cap (table 2). Measured as a percentage of after-tax income, the tax saving from the SALT deduction in 2022 were about one-quarter of the tax savings from the deduction in 2017. For taxpayers in the top 1 percent of the income distribution, the tax saving in 2022 was about one-tenth of the tax saving in 2017.
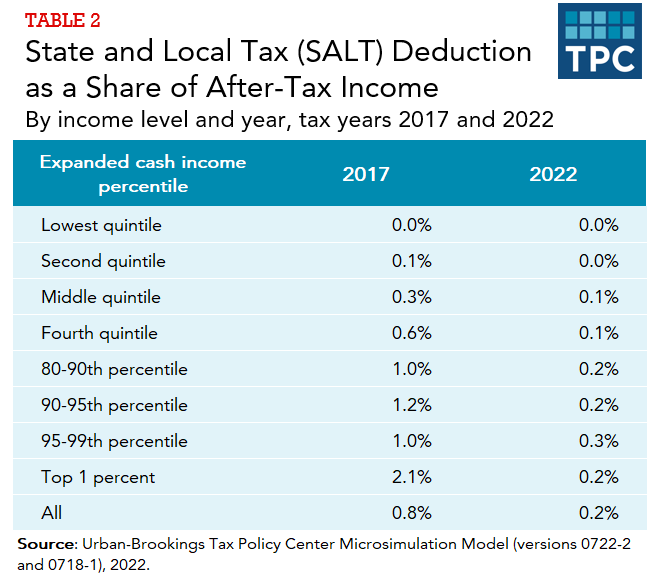
[Note that table 1 shows results by AGI amounts, whereas table 2 shows results by expanded cash income percentiles. For more information on how income measures can vary, please refer to: Income Measure Used in Distributional Analyses by the Tax Policy Center]
However, while high-income households saw less benefit from the SALT deduction as a result of the TJCA cap, most such households still saw federal tax reductions from the TCJA because of other changes in the law (such as lower income tax rates). The amount of federal tax reduction was affected by the SALT cap, though, and taxpayers living in states with higher state and local taxes did generally see relatively smaller net tax cuts.
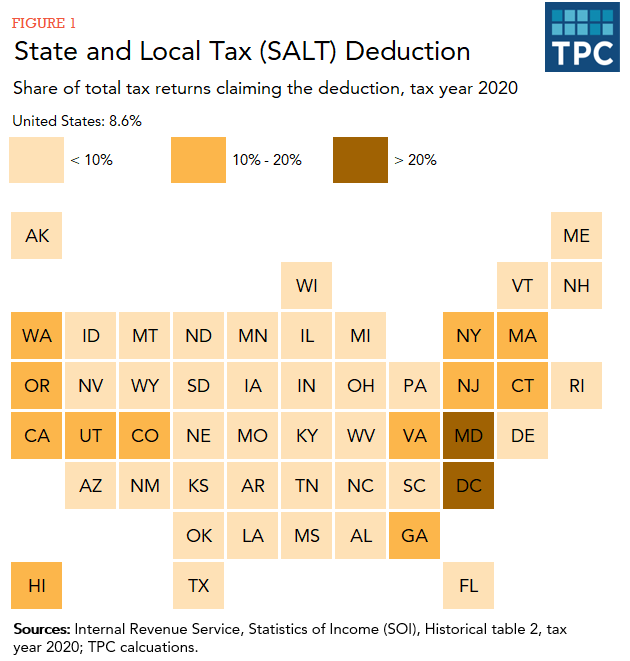
That is, while taxpayers in every state and DC claim the SALT deduction, taxpayers in states with a disproportionate share of high-income taxpayers and relatively high state and local individual income taxes are more likely to claim the deduction (figure 1). The percentage claiming the deduction in 2020 ranged from 3 percent in West Virginia to 21 percent in Maryland. For example, high-income households in states like New York on average saw smaller federal tax cuts from the TCJA than similar households in Texas.
Effects of the SALT deduction on state and local governments
The SALT deduction provides state and local governments with an indirect federal subsidy by decreasing the net cost of nonfederal taxes for those who pay them. For example, if a state increased income taxes by $100 for households in the 37 percent federal income tax bracket, and that household included the tax increase in their SALT deduction, the net cost to them is $63. That is, the household’s state taxes went up by $100, but the household’s federal taxes went down by $37 ($100 x 0.37). Thus, this federal tax expenditure could encourage state and local governments to levy higher taxes (and, presumably, provide more services) than they otherwise would. It also could encourage those governments to use deductible taxes in place of nondeductible taxes (i.e., selective sales taxes on alcohol, tobacco, and gasoline), fees, and other charges.
However, there is not a direct relationship between the SALT deduction and state and local tax changes because the characteristics and politics of those places and governments affect tax and spending decisions. For example, in 2013, the top federal income tax rate increased from 35 percent to 39.6 percent, leading to an increase in the SALT deduction’s indirect subsidy, and ostensibly encouraging state tax increases. However, many states cut taxes in the period following this federal tax change, in part because Republicans advocating for tax cuts took political control of these states. Related, the states most affected by the SALT deduction cap typically have Democratic political control, and these states have not enacted large income tax rate cuts in response to the $10,000 cap.
Still, critics of the SALT deduction argue that state and local taxes simply reflect payments for the services those jurisdictions provide and, as such, should not be subsidized by the federal government. Proponents of the SALT deduction argue that federal subsidies are warranted because a significant portion of state and local government spending is for education, health, public welfare, and transportation, all of which benefit people in other jurisdictions as well. However, others argue that while federal support may be warranted, the substantial revenues gained by eliminating or limiting the deduction could be used to provide direct support through federal grants and loans for activities that have the largest spillover benefits.
State and local taxes have been deductible since the inception of the federal income tax in 1913. Initially, all state and local taxes not directly tied to a benefit were deductible against federal taxable income. In 1964, deductible taxes were limited to state and local property (real and personal), income, general sales, and motor fuels taxes.
Congress eliminated the deduction for taxes on motor fuels in 1978 and eliminated the deduction for general sales taxes in 1986. It temporarily reinstated the sales tax deduction in 2004, allowing taxpayers to deduct either income taxes or sales taxes but not both. Subsequent legislation made that provision permanent starting in 2015. Starting in tax year 2018, taxpayers cannot deduct more than $10,000 of total state and local taxes. That provision of the law is scheduled to expire after 2025.
Internal Revenue Service. 2023. “SOI Tax Stats—Historic Table 2.” Washington, DC.
Internal Revenue Service. 2023. SOI Tax Stats—Individual Income Tax Returns, Publication 1304. Table 1.2. “All Returns: Adjusted Gross Income, Exemptions, Deductions, and Tax Items, Tax Year 2020;” Table 2.1. “Returns with Itemized Deductions: Sources of Income, Adjustments, Itemized Deductions by Type, Exemptions, and Tax Items, Tax Year 2020;” Table 1.2. “All Returns: Adjusted Gross Income, Exemptions, Deductions, and Tax Items, Tax Year 2017”; and Table 2.1. “Returns with Itemized Deductions: Sources of Income, Adjustments, Itemized Deductions by Type, Exemptions, and Tax Items, Tax Year 2017.” Washington, DC.
Urban-Brookings Tax Policy Center. 2022. Table T22-0210: “Tax Benefit of the Itemized Deduction for State and Local Income, Sales, and Real Estate Taxes, Baseline: Current Law, Distribution of Federal Tax Change by Expanded Cash Income Percentile, 2022.” Washington, DC.
US Department of the Treasury. 2023. Tax Expenditures: Fiscal Year 2019 and Tax Expenditures: Fiscal Year 2022. Table 1. Estimates of Total Income Tax Expenditures. Office of Tax Analysis. Washington, DC.
Further ReadingBurman, Leonard E., and Frank Sammartino. 2018. “State Responses to the TCJA’s SALT Deduction Limit May Be Costly and Favor High-Income Residents.” TaxVox (blog). Washington, DC: Urban-Brookings Tax Policy Center.
Dadayan, Lucy, and Noah Zwiefel. 2019. “We Don’t Know If The SALT Cap Is Driving Away Residents Of High-Tax States.” TaxVox (blog). Washington, DC: Urban-Brookings Tax Policy Center.
Gordon, Tracy. 2018. “The Price We Pay for Capping the SALT Deduction.” TaxVox (blog). Washington, DC: Urban-Brookings Tax Policy Center.
Sammartino, Frank. 2016. “A Closer Look at the State and Local Tax Deduction.” TaxVox (blog). Washington, DC: Urban-Brookings Tax Policy Center.
Sammartino, Frank. 2018. “How New York State Responded to The SALT Deduction Limit.” TaxVox (blog). Washington, DC: Urban-Brookings Tax Policy Center.
Sammartino, Frank and Eric Toder. 2019. “What are the Largest Nonbusiness Tax Expenditures?.” Washington, DC: Urban-Brookings Tax Policy Center.
Sammartino, Frank, and Kim S. Rueben. 2016. “Revisiting the State and Local Tax Deduction.” Washington, DC: Urban-Brookings Tax Policy Center.
Urban-Brookings Tax Policy Center. 2020. “Tax Expenditures.” Washington, DC.
Zwiefel, Noah. 2019. “Did SALT-y Voters Punish Republicans in 2018?” TaxVox (blog). Washington, DC: Urban-Brookings Tax Policy Center.